Do you want your receipt? (Yes)
11/3/24
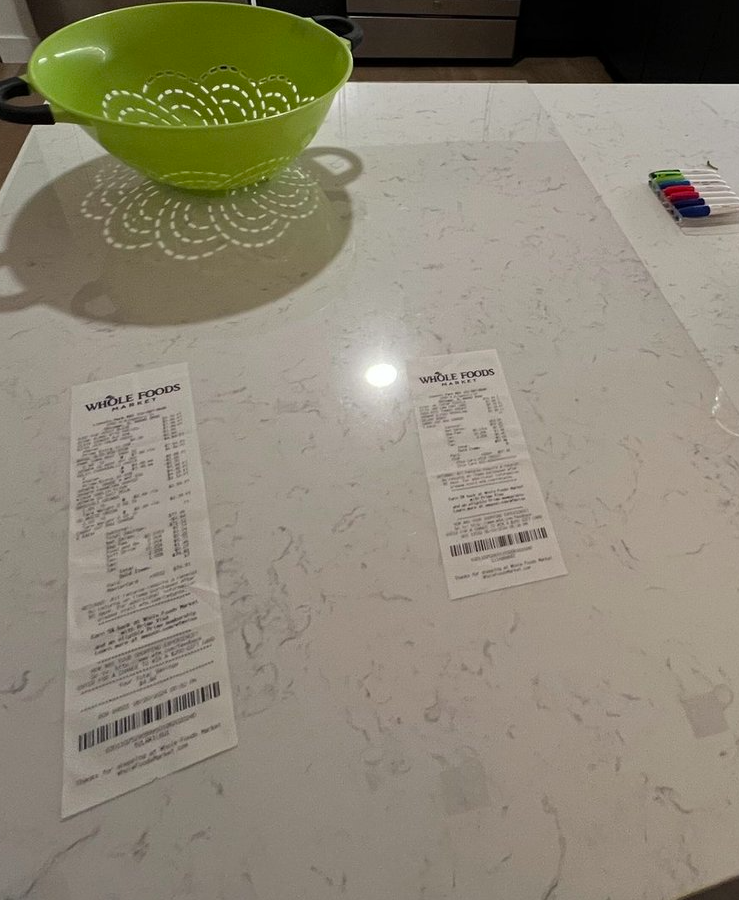
Recently I’ve been responding with a resounding “Yes” whenever a grocery store employee has asked me if I wanted a receipt. Why? A vague idea of a fun project has been floating around in my mind. After a few months of “Yes”, I decided the pile of receipts in the drawer was sufficient, so it was time for project kick off. I had a few burning questions:
- How frequently am I going to the grocery store?
- What does an average trip look like?
- Does the answer to question 1 or 2 vary over time?
- How much price variability is there within item type? e.g. The price of a lemon
- How much price variability is there across different supermarkets?
Tooling wise, I could start getting my questions answered by using Textract, AWS’s OCR service, to extract out the key information. For each receipt, I wanted:
- The store’s name
- The store’s address
- Date the trip happened
- A list of each item on the receipt
- The item’s name
- The item’s price
- The item’s unit price (if applicable)
To get there, I:
- Took pictures of all the receipts and uploaded them to an
S3bucket inAWS- A lot of receipts were folded or crumpled up, so I set a big piece of clear plastic on top of each receipt so it would lay flat before I snapped its photo lol

- Called the AWS
AnalyzeExpenseAPI from Python using theboto3package to create the OCR results- This produces very rich data, including bounding boxes for each word and a confidence level from 0 to 1
- Wrote some code to retrieve / reshape the json response from
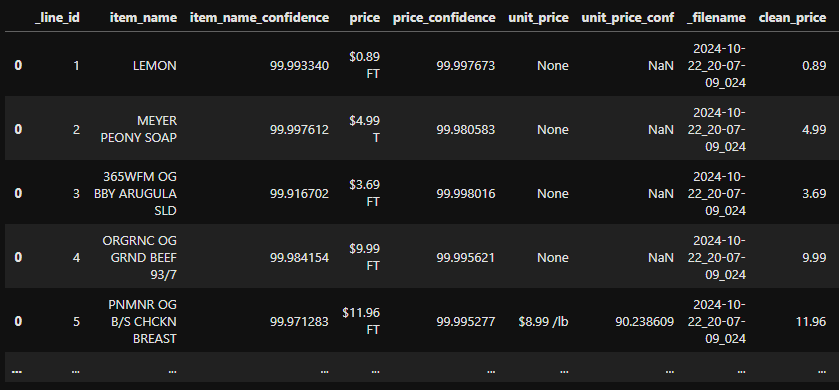
Textractinto apandasdataframe - Did some data cleanup (turned price values like
$0.89 FTinto numbers like0.89)
I ended up with data that looks like this:

I was excited to dive in and start answering my questions, but then I took a closer look at the item_name column. My questions relied on being able to group items by their name, but the name that appears on the receipt isn’t a value that’s easily understood by a human. A few examples:
- PPCRNR KETTLE
- AKA Popcorn
- SOLEMNOATH RT SRS IPA 4PK
- AKA Beer
- ORGRNC OG GRND BEEF 93/7
- AKA ground beef
I’m in a bit of a pickle. I could spend my time writing some heuristics to try and categorize these, maybe like:
def classify_item_name(item_name: str) -> str:
    item_name = item_name.lower().strip()
    if 'soap' in item_name:
        return 'soap'
    elif 'chicken' in item_name:
        return 'chicken'
    ...
However, that gets ugly after like the third classification and would be a nightmare to maintain. I thought about using an prebuilt LLM to classify my items, but I wanted to gain experience interacting with a labeling interface.
After some googling, I came across Label Studio, an open source data labeling interface built with Python. After installing it as a Python package with pip, you can set up labeling jobs for classification and segmentation of text, audio, and video data. The best part? The results of the all the labeling is stored in a local sqlite database, AND they have an API you can use to retrieve the labels.
Pickle resolved. To get Label Studio set up, I:
- Exported my unique source item names to a
.csvfile and uploaded it into Label Studio - Configured the labeling interface using an XML file
- I found this to be a concise and maintainable way to manage the available labels. A bit tedious to update in the beginning but will save me a lot of time down the line
<!-- Sample XML config file for the labeling interface -->
<View>
  <Text name="text" value="$item_name"/>
  <Taxonomy name="taxonomy" toName="text">
    <Choice value="Meat">
      <Choice value="Chicken">
        <Choice value="Chicken - Thighs"/>
        <Choice value="Chicken - Breasts"/>
        <Choice value="Chicken - Rotisserie"/>
      </Choice>
      <Choice value="Beef"/>
      <Choice value="Pork"/>
      <Choice value="Turkey"/>
      <Choice value="Seafood">
        <Choice value="Fish"/>
        <Choice value="Shrimp"/>
        <Choice value="Crab"/>
      </Choice>
    </Choice>
</Taxonomy>
</View>
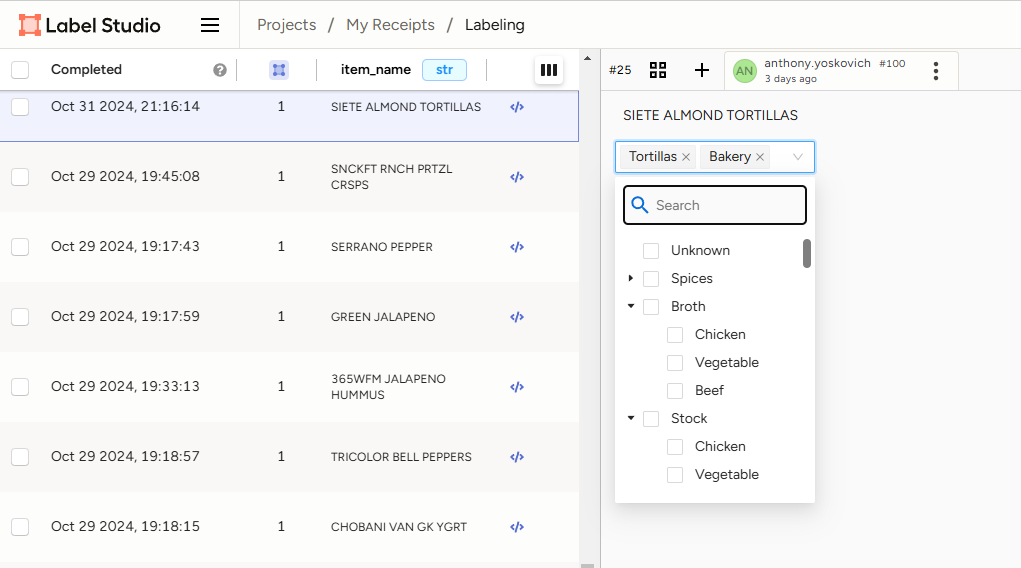
Using that configuration file, the labeling interface looks like this:

Using this UI I can quickly go through the list of my messy item names and put them into organized buckets I can use for further analysis. I haven’t classified my list of more than 500 items yet, but once I was a decent way through I pulled the label data out of Label Studio and combined that into my cleaned receipt data:

The label column holds the data that comes from Label Studio, and the label_n / label_broadest / label_specificist columns are my attempt to restructure those in a useful manner. Certainly wet paint at the moment but it feels like I’m on the right track.
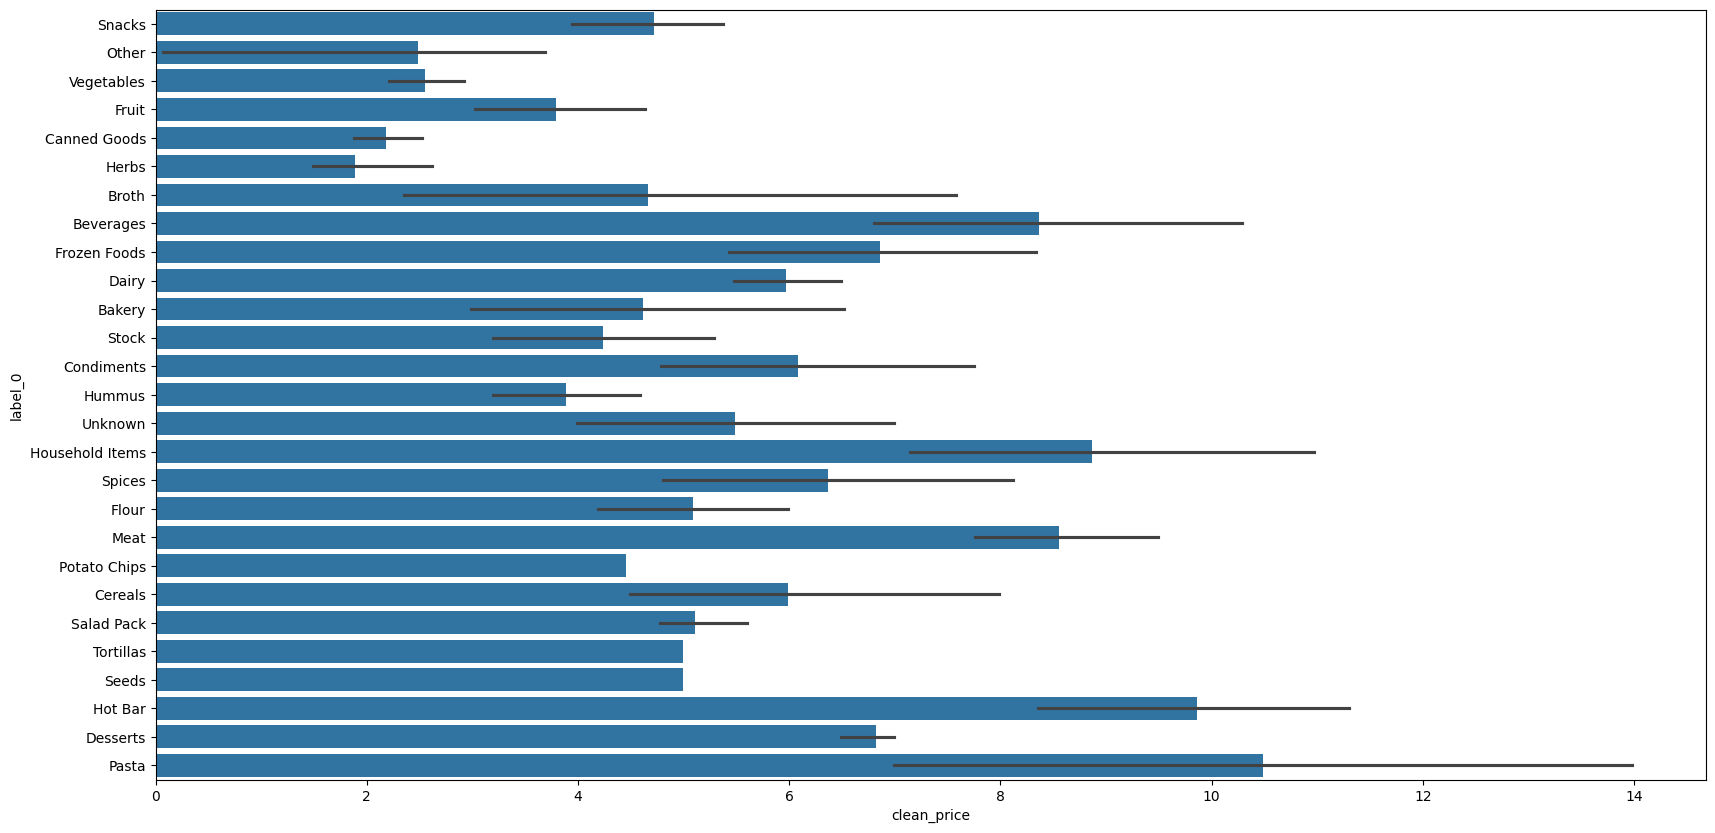
At this point I’ve got a lot more labeling to do, but I just couldn’t resist taking a look at what I had so far just for my own interest…

That shows the average price within each label, including some error bars I’m eager to explain away.
Anyways, next steps for me:
- Label the remaining item names
- Take a closer look at data quality, I may have accidentally taken multiple pictures of the same receipt
- Get my questions answered!